The input and output dictionaries both have mostly positive inner products between randomly selected token vectors (81% positive for input dictionary, 82% for output). The Pearson correlation coefficient between same-token-pair inner products in the input and output vector spaces is 0.29, and it’s important to remember that the vast majority inner products are very small (say, ~0.03) and may to some degree represent noise. Normalization of the output vectors is more variable than for the input vectors. (<v|v>, we have meanout = 1.2, σout = 0.33 versus meanin = 1.1, σin = 0.11)
Trying a random survey of 51 million input token vector pairs, I see 0.47 million with inner products greater than
Refining the search to cases with <v1|v2> > 0.2 in the input dictionary raises the percentage of positive inner products in the output dictionary to 99.875% (15519 out of 15540). More strikingly, 55% also had inner products <v1|v2> > 0.2, which is impressive given the \~0.03% prevalence of token vector pairs with this degree of correlation. Vector pairs with <v1|v2> > 0.2 have more obvious similarities, for example: <v_short|v_long>, <v_daughter|v_girl>, <v_queen|v_prince>
The mean inner product amplitude [mean(abs(<v1|v2>))] is A ~ 0.027 for the input dictionary and A ~ 0.048 for the output dictionary. The dictionary parameter values look like gaussian-distributed random numbers, with a ratio of the standard deviation to mean amplitude of ~1.25 as for the 0-centered normal distribution [1.25 ~ σ/mean(abs(parameter_values))]. Drawing inspiration from this, if we think of the bases as normal-distribution random matrices, the mean inner products described above would suggest an effective rank of 1/A2 ~ 1400 for the input and ~430 for the output token dictionaries. Reducing rank (r<4096) seems like it should be important for these token matrices to allow other information to be encoded in (near-)orthogonal bases.
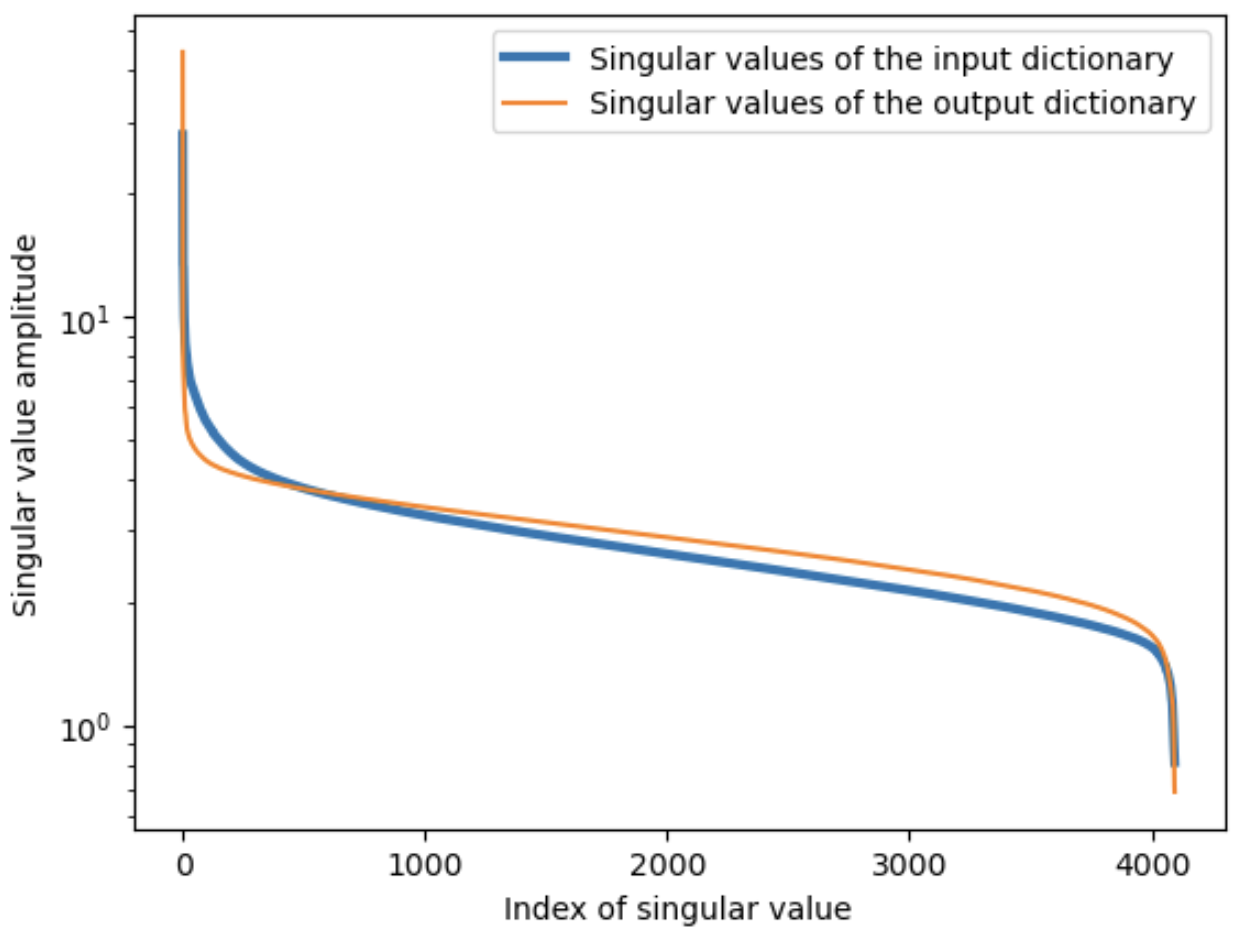
The singular values of the input and output dictionaries are shown below. The value distribution is sloped, but neither case shows any kind of sharp cutoff that would cleanly define a r<4096 rank value of the matrix, so encoding words in either dictionary is likely to create significant noise for other dictionary registries. I'll return to this elsewhere, but it seems to be in keeping with the observation in Section 2.B. that we see no more than a few meaningful words in each registry.
def check_for_transform(mat1=in_lang, mat2 = out_lang,sample_frac = 0.005):
    # check the fraction of negative inner products between vectors parallel to axis

    # mps_device = torch.device("mps")
    # mat = mat_in.to(device=mps_device).detach()  # torch.tensor(mat_in, device=mps_device)

    inc_range, max_range = int(mat1.shape[0]*sample_frac), mat1.shape[0] #assume identical dimensions for mat1 and mat2

    # sample_list = torch.randint(max_range,(inc_range,))
    sample_list = choose_words(num_words = inc_range, vocab_max=max_range)
    allMPs1 = mat1 @ (mat1[sample_list,:].transpose(0,1))
    allMPs2 = mat2 @ (mat2[sample_list,:].transpose(0,1))

    both_vects = torch.cat((allMPs1.flatten(), allMPs2.flatten())).view(2,-1)

    min_val1 = 0.1 # used to select candidates for comparison
    min_val2 = 0
    #check fraction with
    check_list = torch.argwhere(allMPs1.flatten()>min_val1)
    check_list = torch.tensor([check_list[pl][0] for pl in range(len(check_list))])
    # print(check_list[:10])
    # print(torch.argwhere(allMPs2.flatten()[check_list[:30]] < min_val2).shape )

    neg_num = torch.argwhere(allMPs2.flatten()[check_list] < min_val2).shape[0]

    candidates = check_list.shape[-1] - inc_range # assume self-inner-products are all 1
    print('Negative fraction is: ', neg_num/candidates, "out of", candidates, "candidates, with", inc_range*mat1.shape[0], "viewed inner products.")
    # both_vects = torch.cat(((allMPs1.flatten()>min_val1), (allMPs2.flatten()>min_val2))).view(2,-1).double()

    print("Correlation matrix: ", both_vects.corrcoef()) # 0.288 +- 0.002 for in_lang<-->out_lang;  (0.285+0.2871+0.2949+0.2852)/4 = 0.288

    return both_vects

both_vects = check_for_transform(sample_frac = 0.05)